The artificial impactor disturbed boulders within a 30m radius from the center of the impact crater- providing important insight into asteroids’ resurfacing processes.
Professor ARAKAWA Masahiko (Graduate School of Science, Kobe University, Japan) and members of the Hayabusa2 mission discovered more than 200 boulders ranging from 30cm to 6m in size, which either newly appeared or moved as a result of the artificial impact crater created by Japanese spacecraft Hayabusa2’s Small Carry-on Impactor (SCI) on April 5th, 2019. Some boulders were disturbed even in areas as far as 40m from the crater center. The researchers also discovered that the seismic shaking area, in which the surface boulders were shaken and moved an order of cm by the impact, extended about 30m from the crater center. Hayabusa2 recovered a surface sample at the north point of the SCI crater (TD2), and the thickness of ejecta deposits at this site were estimated to be between 1.0mm to 1.8cm using a Digital Elevation Map (DEM). These findings on a real asteroid’s resurfacing processes can be used as a benchmark for numerical simulations of small body impacts, in addition to artificial impacts in future planetary missions such as NASA’s Double Asteroid Redirection Test (DART). The results will be presented at the 52nd meeting of the AAS Division of Planetary Science on October 29th in the session entitled Asteroids: Bennu and Ryugu 2.
The aim of impacting Ryugu with a ~13cm SCI projectile was to recover a sample of the subsurface material. In addition, this provided a good opportunity to study the surface renewal processes (resurfacing) that result from an impact occurring on an asteroid with a surface gravity of 10-5 of the Earth’s gravity. The SCI succeeded in forming an impact crater, which was defined as a SCI crater with a diameter of 14.5 m (Arakawa et al., 2020), and the surface sample was recovered at TD2 (10.04°N, 300.60°E) (Fig. 1). It was discovered that the crater center’s concentric area, which has a radius four times larger than the crater radius, was also disturbed by the SCI impact, causing boulder movement.
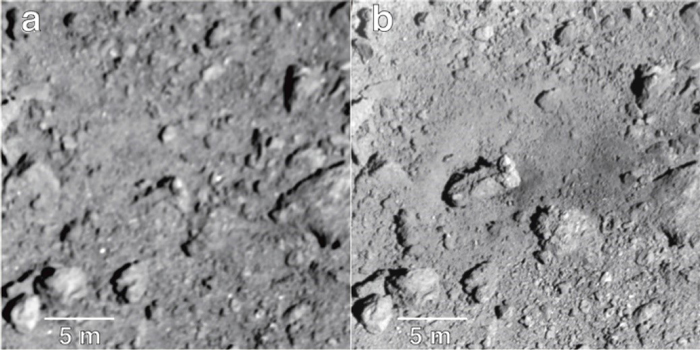
Image credit: JAXA, The University of Tokyo, Kochi University, Rikkyo University, Chiba Institute of Technology, Meiji University, The University of Aizu, AIST.
The researchers subsequently compared surface images before and after the artificial impact in order to study the resurfacing processes associated with cratering, such as seismic shaking and ejecta deposition. To do this, they constructed SCI crater rim profiles using a Digital Elevation Map (DEM) consisting of the pre-impact DEM subtracted from the post-impact DEM (Fig. 2). The average rim profile was approximated by the empirical equation of h=h rexp[-(r/R rim - 1)/λrim] and the fitted parameters of h r and λrim were 0.475m and 0.245m, respectively. Based on this profile, the SCI crater’s ejecta blanket thickness was calculated and found to be thinner than that of the conventional result for natural craters, as well as that calculated from the crater formation theory. However, this discrepancy was solved by accounting for the effect of the boulders that appeared on the post-impact images because the crater rim profiles derived from the DEMs might fail to detect these new boulders (Fig. 3). According to this crater rim profile, the thickness of the ejecta deposits at TD2 were estimated to be between 1.0mm to 1.8cm.
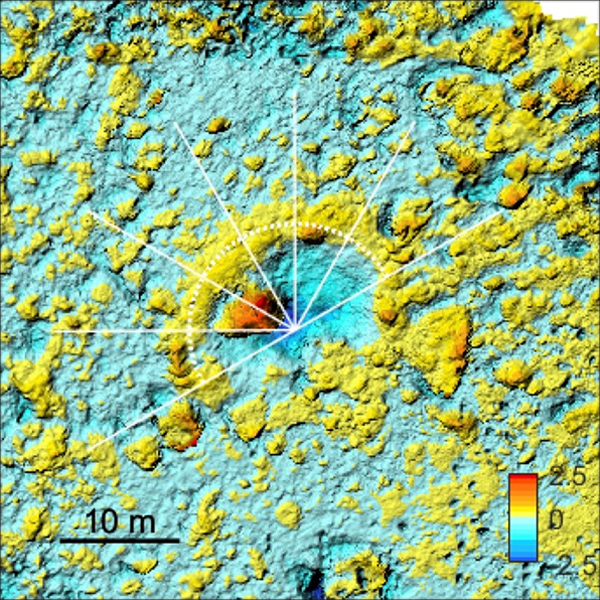
The color scale indicates the height of the surface morphology in meters, and the dotted semicircle shows the SCI crater rim. Image credit: Kobe University, JAXA, The University of Tokyo, Kochi University, Rikkyo University, Chiba Institute of Technology, Meiji University, The University of Aizu, AIST.
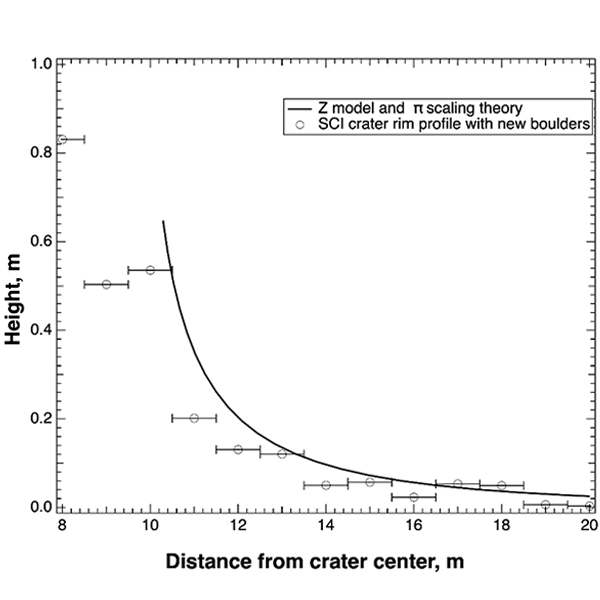
Image credit: Kobe University.
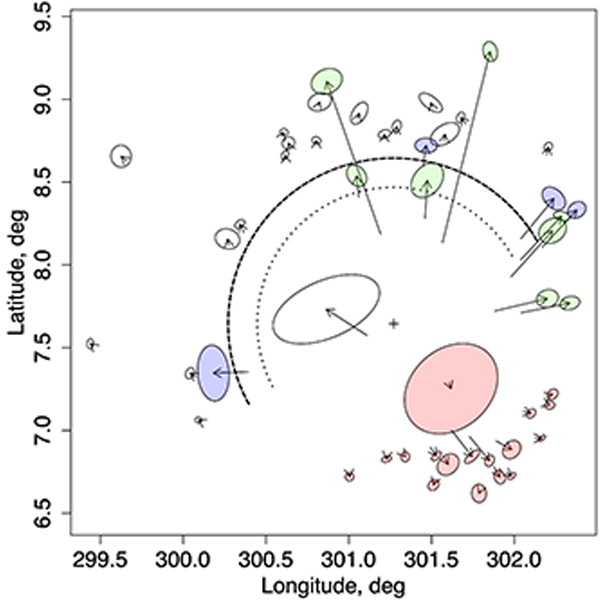
The initial positions of the boulders represented by red ellipses are located outside of the apparent crater to the south of the SCI crater, and that of the purple ellipses are located between the apparent crater radius and the crater rim radius. The shape and position of each ellipsis indicates the approximate shape and scale of the boulder and the post impact position, respectively. Two large boulders named Okamoto and Iijima, and a medium-sized boulder named mb19 are shown for reference. Image credit: Kobe University, JAXA.
The 48 boulders in the post-impact image could be traced back to their initial positions in the pre-impact image, and it was found that the 1m-sized boulders were ejected several meters outside of the crater. They were classified into the following four groups according to their motion mechanisms: 1. excavation flow, 2. pushed by falling ejecta, 3. surface deformation dragged by the slight movement of the Okamoto boulder, and 4. seismic shaking caused by the SCI impact itself (Fig. 4). In all groups, the motion vectors of these boulders seemed to radiate from the crater center.
The 169 new boulders ranging from 30cm to 3m in size were found only in the post-impact images, and they were distributed up to ~40m from the crater center. The histogram of the number of new boulders was studied in each radial width of 1m at a distance of 9–45m from the crater center, with the maximum number of boulders being found at a distance of 17m. Beyond 17m, the number of boulders decreased in accordance with the increase in distance from the crater center.
To investigate this further, a correlation coefficient evaluation between the pre- and post-impact images was carried out. It was discovered that the low cross-correlation coefficient region outside the SCI crater has an asymmetric structure (Fig. 5), which is very similar to the area around the impact point where ejecta were deposited (Arakawa et al., 2020). Based on a template matching method using the correlation coefficient evaluation, the boulder displacements with cross-correlation coefficients above 0.8 were derived with a resolution of ~1cm. This indicated that these displacements could be caused by the seismic shaking (Fig.6). Boulders were moved by more than 3cm in the area close to the SCI crater. This disturbance spans an area up to 15m from the impact, with the motion vectors radiating out from the crater center. Disturbed areas that were displaced by 10cm still exist in the regions farther than 15m from the center, however they appeared as patches of a few meters in size and were distributed randomly. Furthermore, the direction of these motion vectors in the distant regions was almost random and there was no clear evidence indicating the radial direction from the crater center.
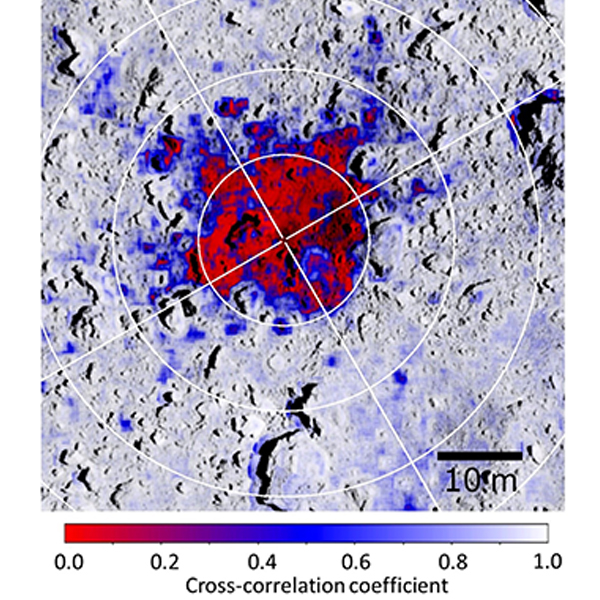
The cross-correlation coefficient is described by the color gradient on the map. Numbers and arrows indicate four projections showing the low cross-correlation coefficient. Image credit: Kobe University, JAXA, The University of Tokyo, Kochi University, Rikkyo University, Chiba Institute of Technology, Meiji University, The University of Aizu, AIST.
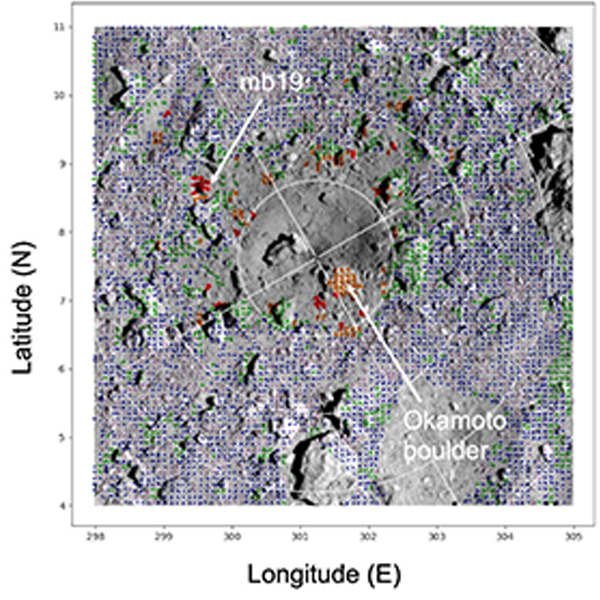
The arrows indicate the movement of each boulder from their initial positions as a result of the impact. Each color shows the distance moved as follows: purple for 0-1cm, blue for 1-3cm, green for 3-10cm, orange for 10-30cm, and red for 30-100cm. Image credit: Kobe University, JAXA, The University of Tokyo, Kochi University, Rikkyo University, Chiba Institute of Technology, Meiji University, The University of Aizu, AIST.
Displacements larger than 3cm were detected within a 15m distance with a probability of more than 50%, and between 15m and 30m with a probability of approximately 10%. Therefore, Arakawa et al. propose, in accordance with Matsue et al. (2020)’s experimental results, that the seismic shaking caused most of the area’s boulders to move at a maximum acceleration 7 times larger than Ryugu’s surface gravity (gryugu). Furthermore, they also discovered that the impact moved boulders at a maximum acceleration of between 7gryugu and 1gryugu in about 10% of the area. It is hoped that these results will inform future numerical simulations of small body collisions, as well as planetary missions involving artificial impacts.
Acknowledgments
This work was supported in part by Grants-in-Aid for Scientific Research (no. 17H06459, and no. 19H00719) from the Japan Ministry of Education, Culture, Sports, Science and Technology. This study was supported by the JSPS Core-to-Core program “International Network of Planetary Sciences.”
References
- Arakawa et al., 2020. An artificial impact on the asteroid (162173) Ryugu formed a crater in the gravity-dominated regime. Science. 368, 67-71.
- Matsue et al., 2020. Measurements of seismic waves induced by high-velocity impacts: Implications for seismic shaking surrounding impact craters on asteroids. Icarus. 338, 113520.


