A research team led by Professor TAKUMI Toru of Kobe University’s Graduate School of Medicine (also a Senior Visiting Scientist at RIKEN Center for Biosystems Dynamics Research) have identified ‘social cells’ in the brain that are related to social behavior. The cells were identified via Ca imaging (*1) conducted using a microendoscope (*2). It is expected that further research will illuminate the neural network for decision-making in social behavior.
These research findings were published in the American scientific journal ‘PLOS Biology’ on September 21.
Main points
- Using a microendoscope, the research team discovered social cells in the cerebral insular cortex (*3) of mice that are related to social behavior.
- The insular cortex acts as an interface between social and emotional modules in the ‘social decision-making network’.
- It is known that the insular cortex is altered in various neuropsychiatric disorders such as schizophrenia and autism. The results of this study provide insight into the social functions of the insular cortex at a cellular level
Research Background
Social distancing is one of the methods that is being endorsed to prevent widespread novel coronavirus infection. It has been said that a physical distance of 2 meters is necessary to prevent virus transmission. How are distances between people, socially distanced exchanges and societal interactions determined?
This kind of social behavior is a complex behavioral pattern consisting of ‘sensory inputs’, ‘internal states’ and ‘decision making’ that span the stages from ‘sensory processing’ to ‘behavior modification’. The behavioral pattern sequence begins with individuals using multimodal (*4) sensory cues (such as sight, smell, hearing and touch) to process information about another individual. This information is then referenced against (social) internal states (such as motive, arousal, emotion, interoception and memory) and behavior is decided upon (for example, investigative, mating, aggressive, nurturing or dominating behaviors).
It is understood that regions of the brain such as the amygdala, pituitary, mesencephalon and the prefrontal cortex are involved in social behavior. However, the detailed neural networks of these regions are not yet well understood, particularly at a cellular level.
Methods to map neural activity across the entire brain have been developed. These include functional MRI and mapping the expression of immediate-early genes, such as c-fos. In addition, specific neural network regions in freely moving mice have been monitored by methods including fiber photometry and Ca imaging conducted using a miniaturized fluorescence microscope affixed to the rodent’s head (as in this study), in addition to observations conducted with a two-photon microscope on mice with their heads fixed in place.
Research Methodology and Findings
A test mouse was placed in a ‘home cage’ and its behavior towards either a stranger mouse (that it had never come into contact with before) or a static object placed in the same cage was observed (Figure 1A). Both the duration and frequency of interactions between the test mouse and stranger mouse were significantly greater than the test mouse’s interactions with the static object (Figure 1B). The test mouse demonstrated social behaviors, including contact with the nose, body and anus of the stranger mouse (Figure 1C).
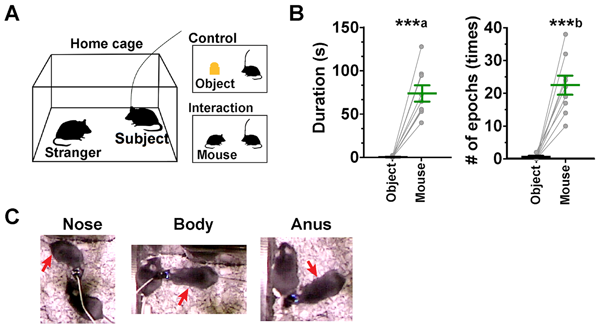
B. Contact duration and frequency of the test mouse’s interactions with an object or a stranger mouse.
C. Mouse-to-mouse contact behaviors.
The research team injected Ca indicator (GCaMP) (*5) into the insular cortex of mice using an adeno-associated virus vector. Next a GRIN lens (*6) was inserted into the agranular insular cortex (AI). This enabled the research team to use Ca imaging conducted via the miniaturized fluorescence microscope fixed to each mouse’s head to record the neural activity of freely moving mice (Figure 2A).
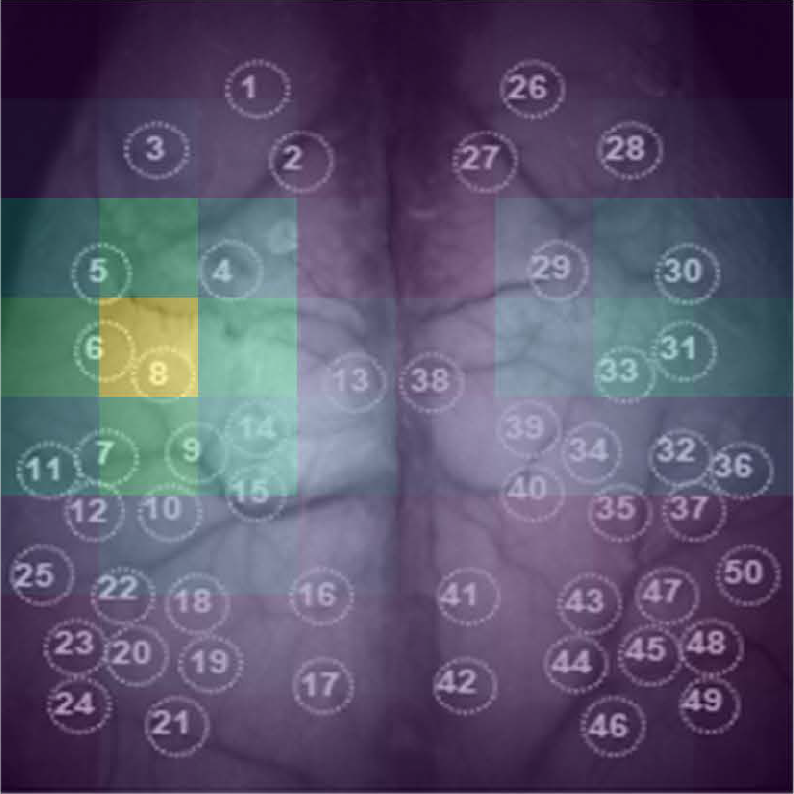
Cellular recordings of the nerve cells (neurons) of nine mice were analyzed. Through this analysis, two types of neurons were identified; Social-ON cells, the activation of which corresponds with social interactions, and Social-OFF cells, which are active when there is no social interaction. Out of a total of 737 neurons, Social-ON cells accounted for 22.8% (168 cells) and Social OFF cells made up 1.4% (10 cells). When the test mouse was stationary during social interaction, 60.1% of the 168 Social-ON cells were active. On the other hand, 7.1% were active when the mouse was moving during social interaction. In addition, the percentage of active Social-ON cells in the test mouse correlated with different types of contact with the stranger mouse (nose-to-nose contact: 35.7% of Social-ON cells active, contact with body: 20.2%, and contact with anus: 5.4%) (see Figure 2E).
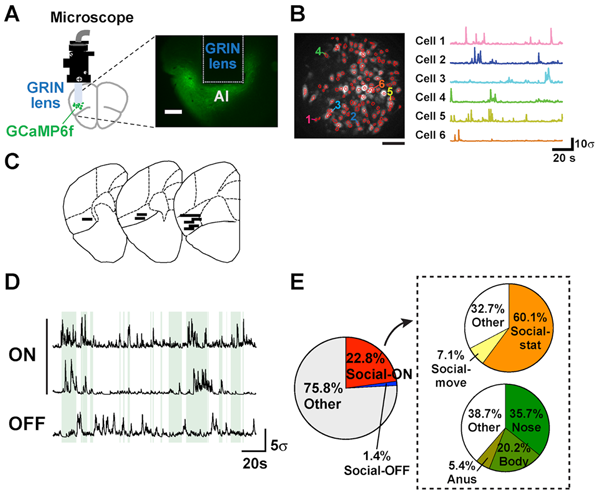
B. Changes in GCaMP6f fluorescence in six cells.
C. Reconstructed images of the GRIN lens implanted in the AI.
D. Traces of 2 Social-ON cells and 1 Social-OFF cell.
E. Pie charts showing the subcategories of neurons.
Next a different test was conducted where a mouse was placed in a rectangular chamber, with two smaller divided off sections (Section A and B respectively) at either end (see Figure 3A). For the control experiment, Sections A and B were left empty. For the 1st Interaction experiment, a static object was placed in Section A and a stranger mouse was placed in Section B. For the 2nd Interaction, the positions of the object and stranger mouse were reversed. In each experiment the test mouse’s behavior was observed for 4 minutes and the difference in the duration of social interaction (contact) was investigated for each experiment. In the control experiment, there was no difference in the time spent between Sections A and B. However, in the both 1st and 2nd Interaction experiments, the test mouse had a longer contact time with the section that contained the stranger mouse (1st Interaction: Section B, 2nd Interaction: Section A) (Figure 3B).
Moreover, the researchers were able to identify Social-ON cells (that responded to the presence of the stranger mouse) and Social-OFF cells (active during periods of no social interaction) through analysis of the neurons inside the AI. These cells reacted to the stranger mouse, regardless of whether it was placed in Sections A or B (Figure 3C).
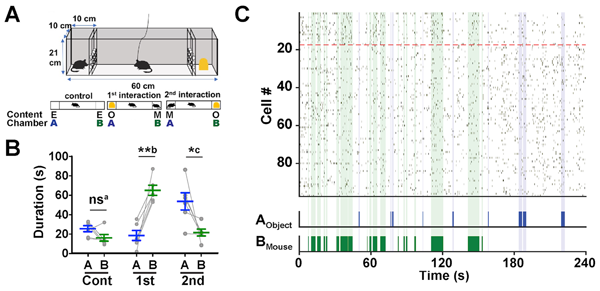
B. Graph to show the duration of social interaction (contact) in each experiment.
C. A raster plot indicating the Ca events of 99 neurons in the AI during social interaction in the 1st Interaction experiment. The cells that reacted to the stranger mouse are plotted above the red dotted line. The blue and green shaded sections show contact behaviors.
Further Research
The insular cortex is anatomically situated to integrate multimodal sensory social cues into the ‘Social decision-making network’, which consists of the ‘social behavior network’ and the mesolimbic reward system. This research succeeded in directly observing AI activity during social interaction at a single cell level, providing new insight into the cellular basis of the insular cortex’s social functions. In other words, the researchers identified a large number of Social-ON cells and a smaller number of Social-OFF cells that demonstrated opposing activity during social interactions. Further research to identify and manipulate the activity of Social-ON and Social-OFF cells’ projection targets is expected to advance our understanding of them at a circuitry level.
Furthermore, this discovery regarding the characteristics of AI neurons implies that the insular cortex can induce a bottom-up process in response to salient stimuli (strong sensory stimuli). This result corresponds with knowledge accumulated so far regarding how the insular cortex acts as an interface between social and emotional modules in the ‘social decision-making network’.
In addition, it is known that the structure and function of the insular cortex is altered in various neuropsychiatric disorders such as schizophrenia and autism. The results of this study provide insight into the social functions of the insular cortex at a cellular level. Next, further analysis will be carried out using animal models of these neuropsychiatric disorders.
Acknowledgements
Part of this study received the following funding: A Japan Society for the Promotion of Science (JSPS) Grant-in-aid for Scientific Research (S), A JSPS Grant-in-Aid for Scientific Research on Innovative Areas: ‘Dynamic regulation of brain function by Scrap & Build system.’ and a research grant from the Takeda Science Foundation.
Glossary
1. Ca imaging
Microscopy technique to optically measure calcium levels in cells or structures etc.
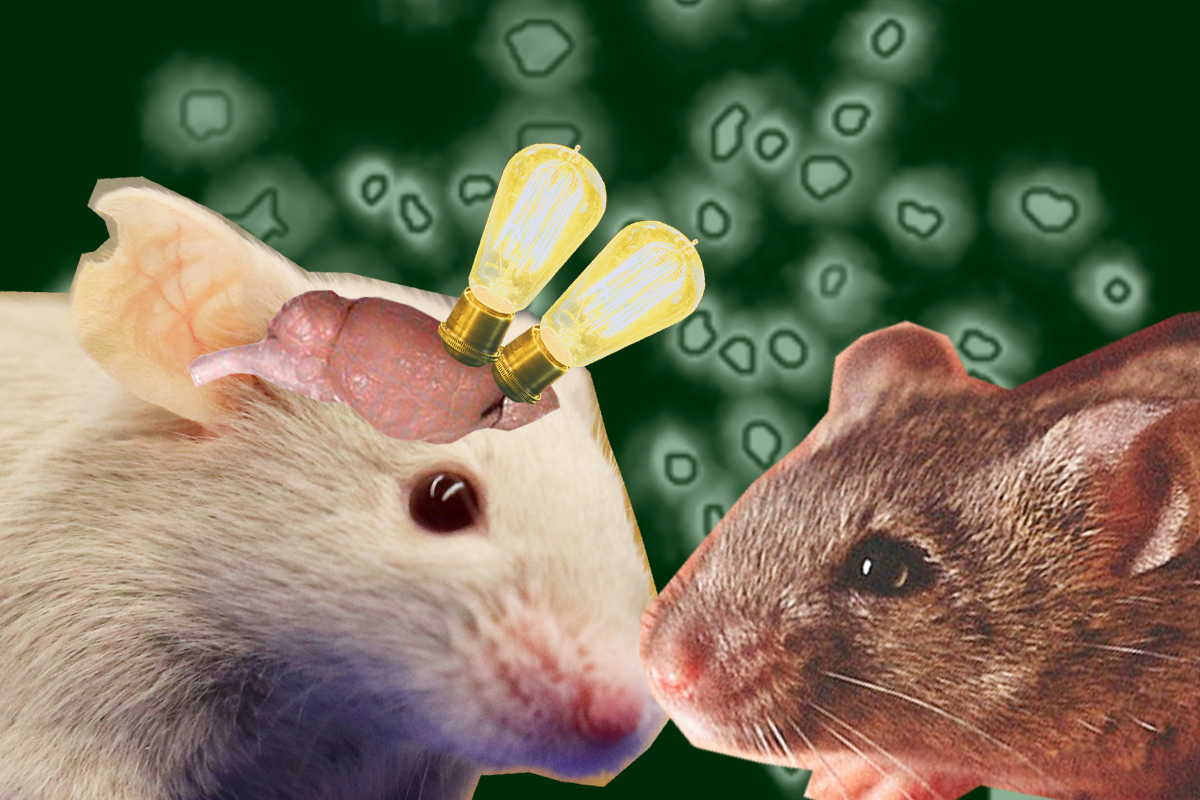
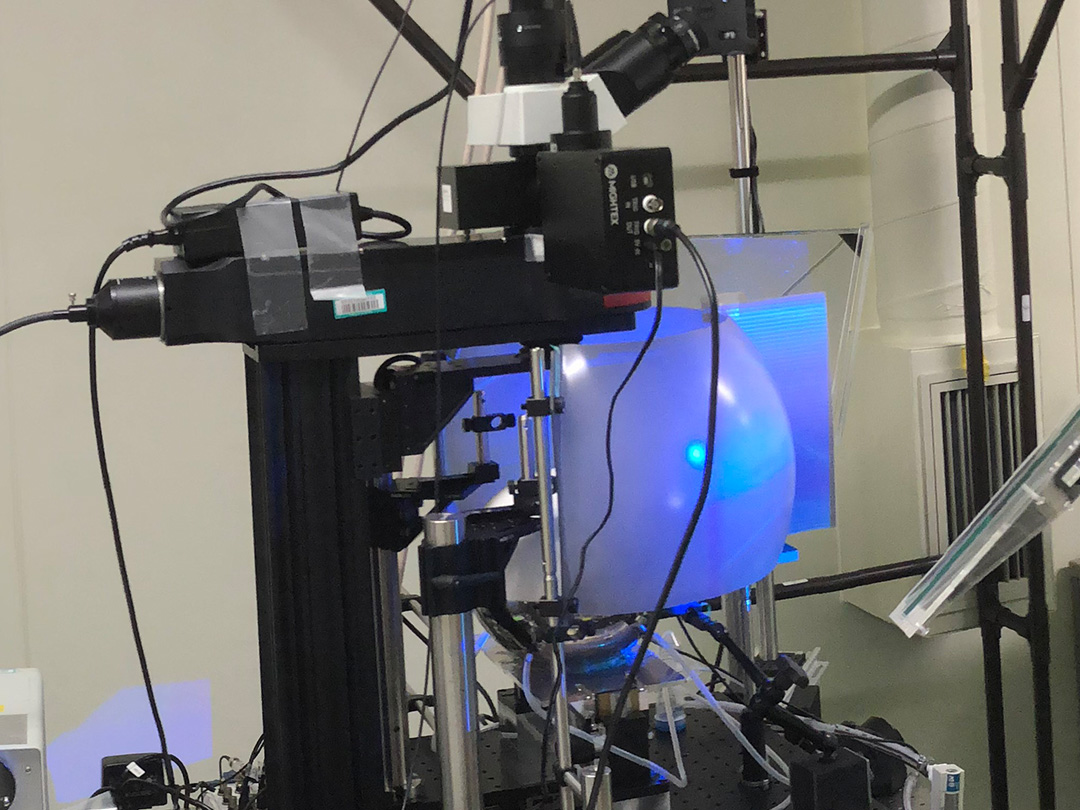
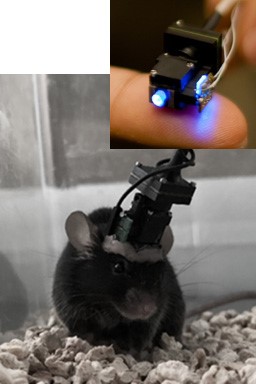
2. Microendoscope
A small fluorescence microscope that can be attached to the head of a mouse or other type of rodent (see image on the right). When utilized with a GRIN lens, it is possible to generate imaging of deep regions of the brain.
3. Insular cortex
A portion of the cerebral cortex which is surrounded by the frontal lobe, temporal lobe, parietal lobe and basal nucleus. Structurally, the agranular insular cortex that makes up the anterior portion lacks a granular cell layer, while all the layers of the posterior portion’s granular insular cortex are clearly defined. The anterior insular cortex demonstrates activity related to cognitive functions such as behavioral expression, perception, interoception and emotion. In addition to the senses (such as taste, smell, touch and pain), it is also related to the reward system, social rejection, social emotions, empathy, awareness of internal organs and self-awareness. Clinically, the insular cortex has been shown to play a role in various neuropsychiatric disorders.
4. Multi-modal
An interface pattern whereby a system is interacted with using multiple communication methods including looking and listening.
5. Ca indicator (GCaMP)
An indicator used to observe calcium ion concentration in cells. GCaMP is a genetically engineered protein probe consisting of a fusion of enhanced green fluorescent proteins (EGFP), calmodulin (CaM) and a myosin light chain peptide sequence (M13). When the calcium ion binds to calmodulin, the resulting Ca2+/CaM compound interacts with M13 to change the structure of EGFP. This alters the intensity of the fluorescence. In other words, it is possible to understand changes in calcium concentration by observing the changes in fluorescence intensity.
6. GRIN lens
A Gradient Index (GRIN) lens is a lens that radially refracts light that enters the lens medium. They are used in the construction of long and narrow optical systems.
Journal Information
Title
“Encoding of social exploration by neural ensembles in the insular cortex”
DOI
10.1371/journal.pbio.3000584
Authors
Isamu Miura, Masaaki Sato, Eric T.N. Overton, Nobuo Kunori, Junichi Nakai, Takakazu Kawamata, Nobuhiro Nakai, Toru Takumi
Journal